|
Title
Fracking and its Potential Effects on California's Limited Water Resources |
|
|
Author
Dennis Decelle American River College, Geography 350: Data Acquisition in GIS; Spring 2013 Contact Information: d.decelle@hotmail.com |
|
|
Abstract
This project will examine fracking in California focusing on locations of fracking operations and related issues of water availability, water usage, wastewater disposal and potential for contamination of major aquifers. |
|
|
Introduction
Hydraulic fracturing, or “fracking” is a process that involves injecting large volumes of water mixed with various chemicals and sand under high pressure into deep underground shale rock formations to fracture the rock and release the trapped oil and gas. California sits atop the Monterey/Santos shale formations which contain an estimated 15 billion barrels of recoverable oil. (EIA, 2011) Fracking to recover this oil will use vast amounts of fresh water from surface and groundwater sources. The wastewater that comes back to the surface contains the fracking fluid, oil residues and salt water that is present in the shale formation. This wastewater is then pumped into deep underground disposal wells. There is mounting evidence that fracking operations have already contaminated groundwater in California. Using the well data from the California Department of Oil, Gas and Geothermal Resources (DOGGR) I will identify where the active fracking wells, water source wells and water disposal wells are in California and examine their spatial relationships to major aquifers, groundwater stress areas and baseline water stress areas. |
|
|
Background
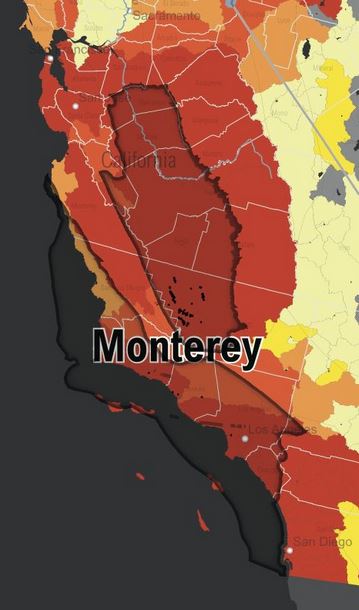
California sits atop the Monterey/Santos shale formations which are estimated to contain about 2/3 of the oil shale deposits in the United States. (EIA, 2011) The Monterey shale runs primarily under the San Joaquin Valley from Stanislaus County in the north to Kern County in the south. The Santos shale runs along the coast and extends out into the Pacific Ocean from San Luis Obispo County in the north to Orange County in the south. Although fracking has been used commercially since the late 1940’s, advances in fracking technologies over the last decade have made it more profitable for oil and gas companies to pursue these oil and gas resources. (Cooley and Donnelly, 2012) The area of the Monterey/Santos shale where oil is considered technically recoverable and is actively under lease as of 2010 covers 1,752 square miles. (EIA, 2011) This is an area where water withdrawal for homes, farms and businesses is already at 80% of available flow which ranks it as an area under extremely high water stress. (Baker,2013) The input water that is mixed with chemicals and sand and used to pressurize a fracking well is pumped from clean surface water or groundwater sources near the fracking wells. Monterey Shale Image Snip: (Ceres,2013) |
|
|
The average fracked well in California uses 166,714 gallons of water. This is based on data voluntary submitted by oil and gas companies to fracfocus.org, an oil and gas industry website.
(Baker,2013)
This may be a low estimate since not all companies volunteer their data and none of the data submitted is verified by a third party.
(Septoff, 2013)
However, less water is used per fracked well in California than in other states. This is due to California’s shale formations containing large amounts of salt water mixed with the oil requiring less water from the surface to pressurize a well.
(Baker,2013)
The U.S. Energy Information Administration figures it would require 16 fracking wells per square mile to recover all of the oil in the Monterey/Santos shale. Since 1,752 square miles of the shale deposits are technically recoverable that amounts to 28,032 wells using on average 166,714 gallons of water for a total of close to 4.7 billion gallons of water. Enough to fill 228, 268 Olympic sized pools. Again this is most likely a low estimate.
Water used by farms, homes and businesses either evaporates, percolates back into the groundwater table or is discharged to surface water after treatment, thus re-entering the water cycle. The fresh water used in fracking is so contaminated in the end that the cheapest option is disposal into deep injection wells where it is permanently removed from the water cycle. So fracking is essentially trading a renewable water resource for a non renewable energy resource. The types of contaminates found in fracking wastewater “can include, but is not limited to: • salts, which include chlorides, bromides, and sulfides of calcium, magnesium, and sodium; • metals, which include barium, manganese, iron, and strontium, among others; • oil, grease, and dissolved organics, which include benzene and toluene, among others; • naturally occurring radioactive materials; and • production chemicals, which may include friction reducers to help with water flow, biocides to prevent growth of microorganisms, and additives to prevent corrosion, among others.” (GAO,2012) This wastewater is either stored in above ground tanks or lined storage ponds until it is hauled away by tanker truck for disposal. More than 90% of fracking wastewater is pumped into deep underground injection wells. (GAO,2012) This water can potentially contaminate groundwater or surface waters from blowouts or spills at the wellhead, leaks from storage tanks or storage pits, spills while filling or emptying tanker trucks and spills due to accidents during transport. (Cooley and Donnelly, 2012) Leaks in poorly constructed disposal wells, migration from disposal wells through unknown fractures in confining rock layers, or migration into improperly plugged wells or leaking wells nearby could potentially contaminate groundwater aquifers as well. Injected fluids can migrate more than a quarter mile away from a well. (Henry and Galbraith, 2013) Lawsuits filed in California by farmers whose groundwater has been contaminated by fracking wastewater are mounting. Farming “is California’s No. 1 industry, with 81,500 farms producing $43.5 billion in annual profits in 2011” (Garcia 2013) making it a huge contributor to our economy. It is a sustainable industry that relies on clean water. People rely on clean water. California’s water resources are already stressed. Is fracking for finite oil and gas resources for short term gain worth the risk? |
|
|
Methods
I downloaded the “All Wells” dataset from the DOGGR website which is a shapefile of all wells related to oil, gas and geothermal resources, last updated on 3/6/2013. Since this dataset contains over 215,000 wells I used the look-up table of codes for well type and status and performed definition queries to create separate layers for each well type and status that suited my project. I downloaded California county boundaries from Cal-Atlas to spatially join the well data to counties for analysis. The Aquifer data was downloaded from the National Atlas and definition queried to create layers of the major aquifers most affected by fracking in California. Using select by location I was able to identify wells that intersected the aquifer layers. I then exported these layers into a file geodatabase. Another resource was the World Resource Institute’s (WRI) Aqueduct global water risk maps which supplied me with .lyr files for areas of groundwater stress and baseline water stress. I used these as base maps as well as a World Terrain base map from ESRI. |
|
|
Results
|
|
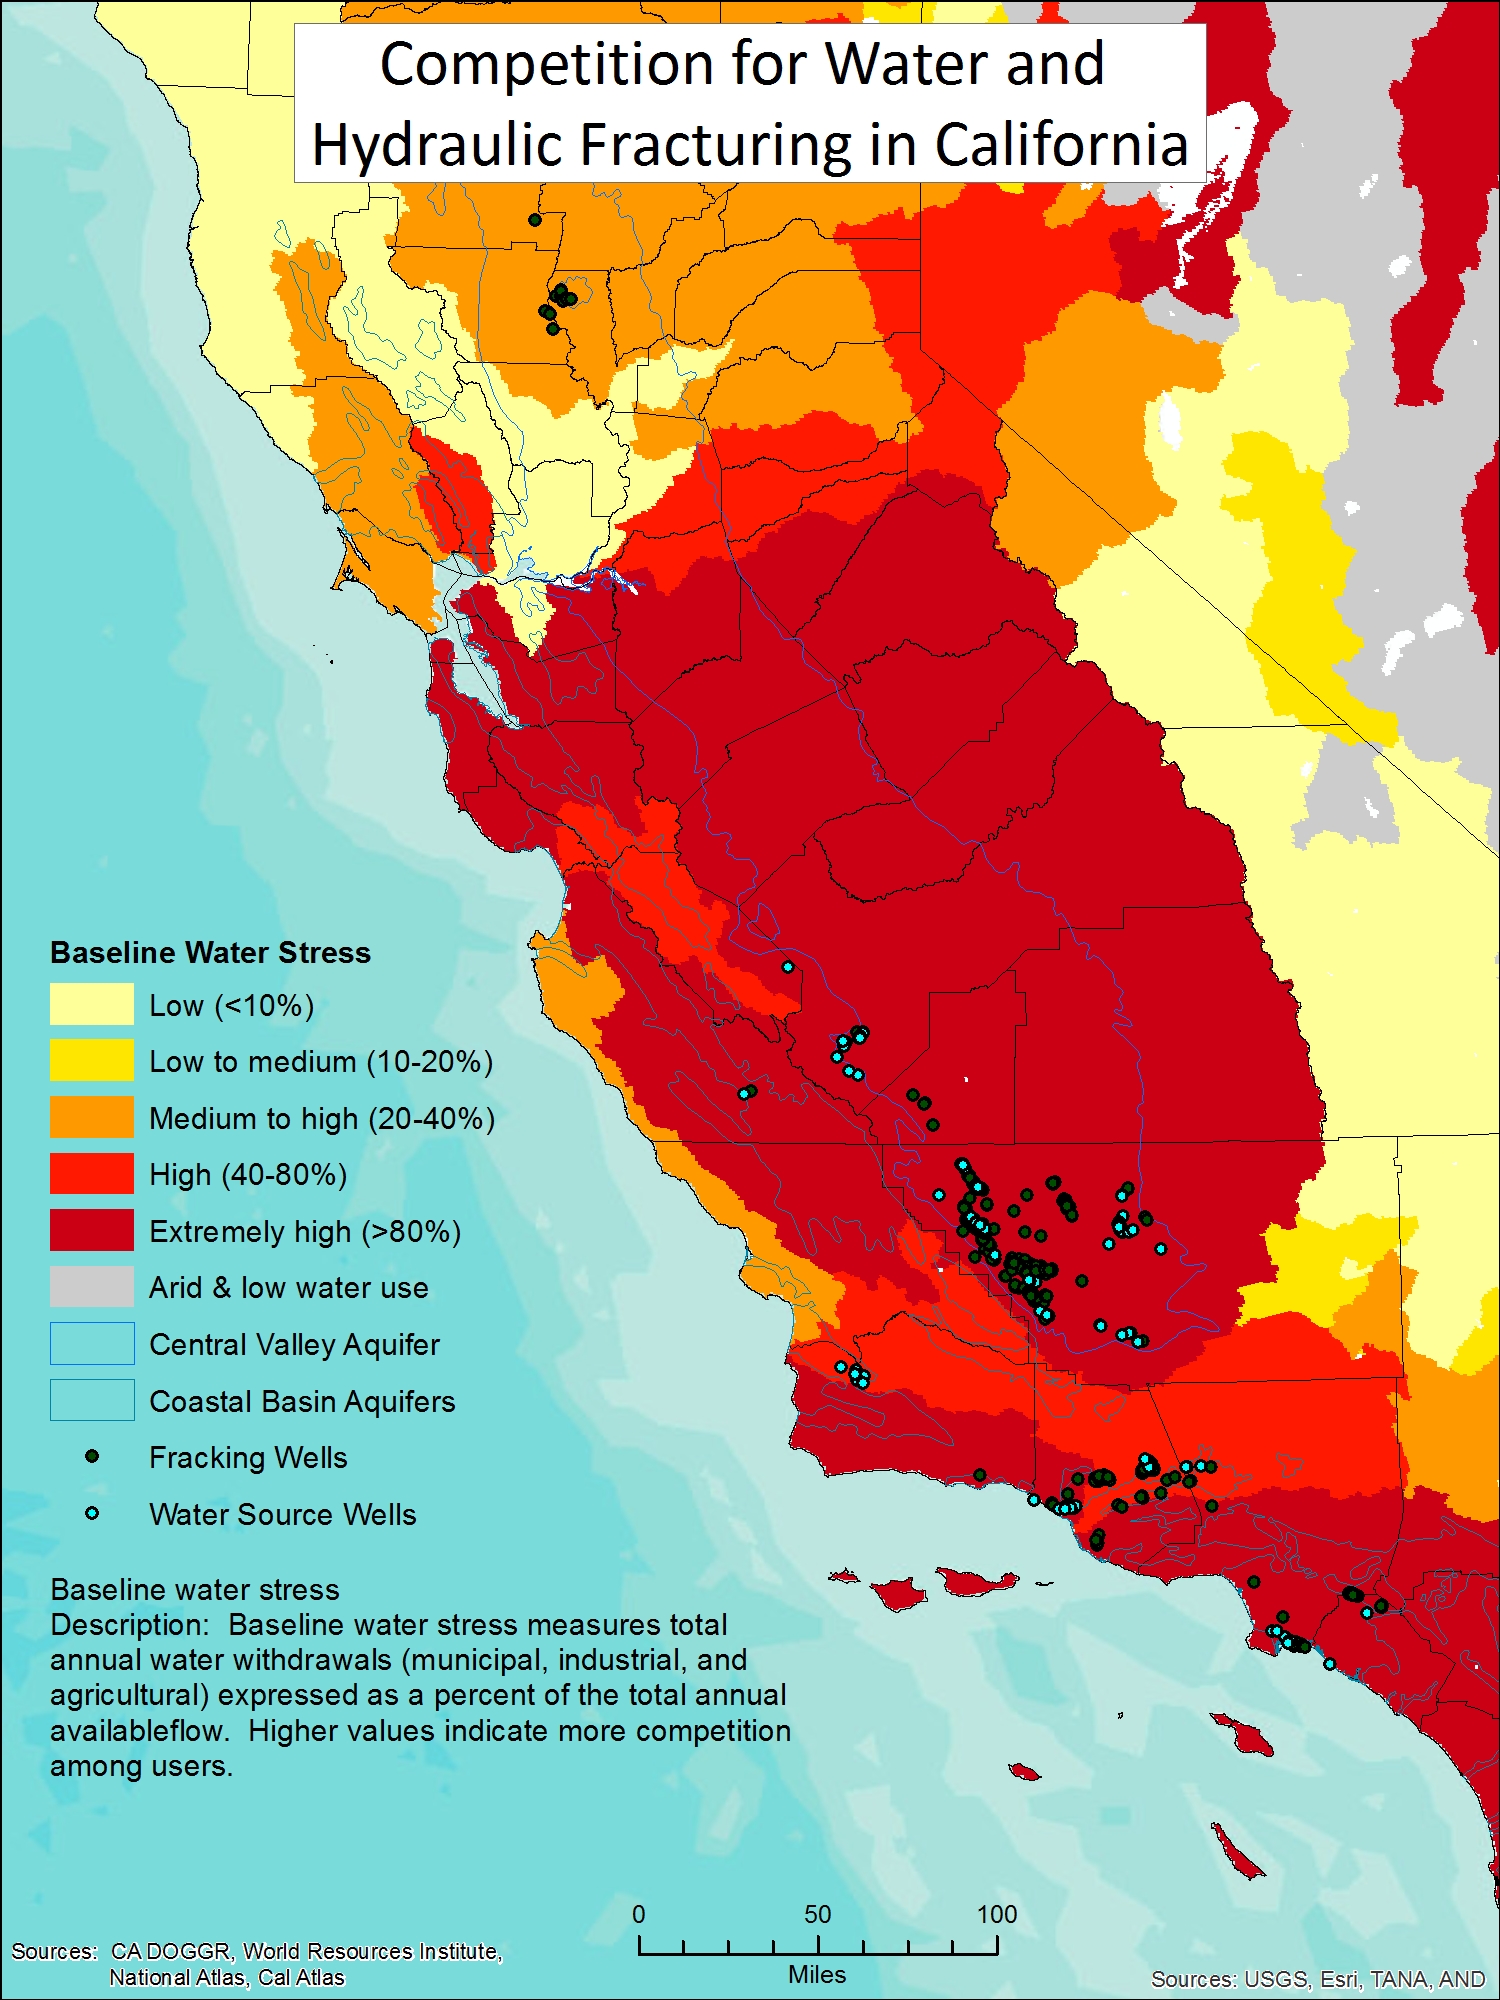 |
As you can see from the map at left most of central and southern California is under high to extremely high baseline water stress (BWS) which is a measure of total annual water withdrawals (municipal, industrial and agricultural) as a percent of the total annual available flow. When I layered the active water source wells and fracking wells over the BWS layer it revealed that most of the water withdrawals and fracking operations are happening in areas under extremely high BWS. There are a total of 137 active water source wells in California. 10% are drawing water in areas under high BWS and 90% are drawing water in areas under extremely high BWS. Of the 1,210 fracking wells in California: 1% are operating in areas under medium to high BWS, 35% in areas under high BWS and 64% in areas under extremely high BWS. |
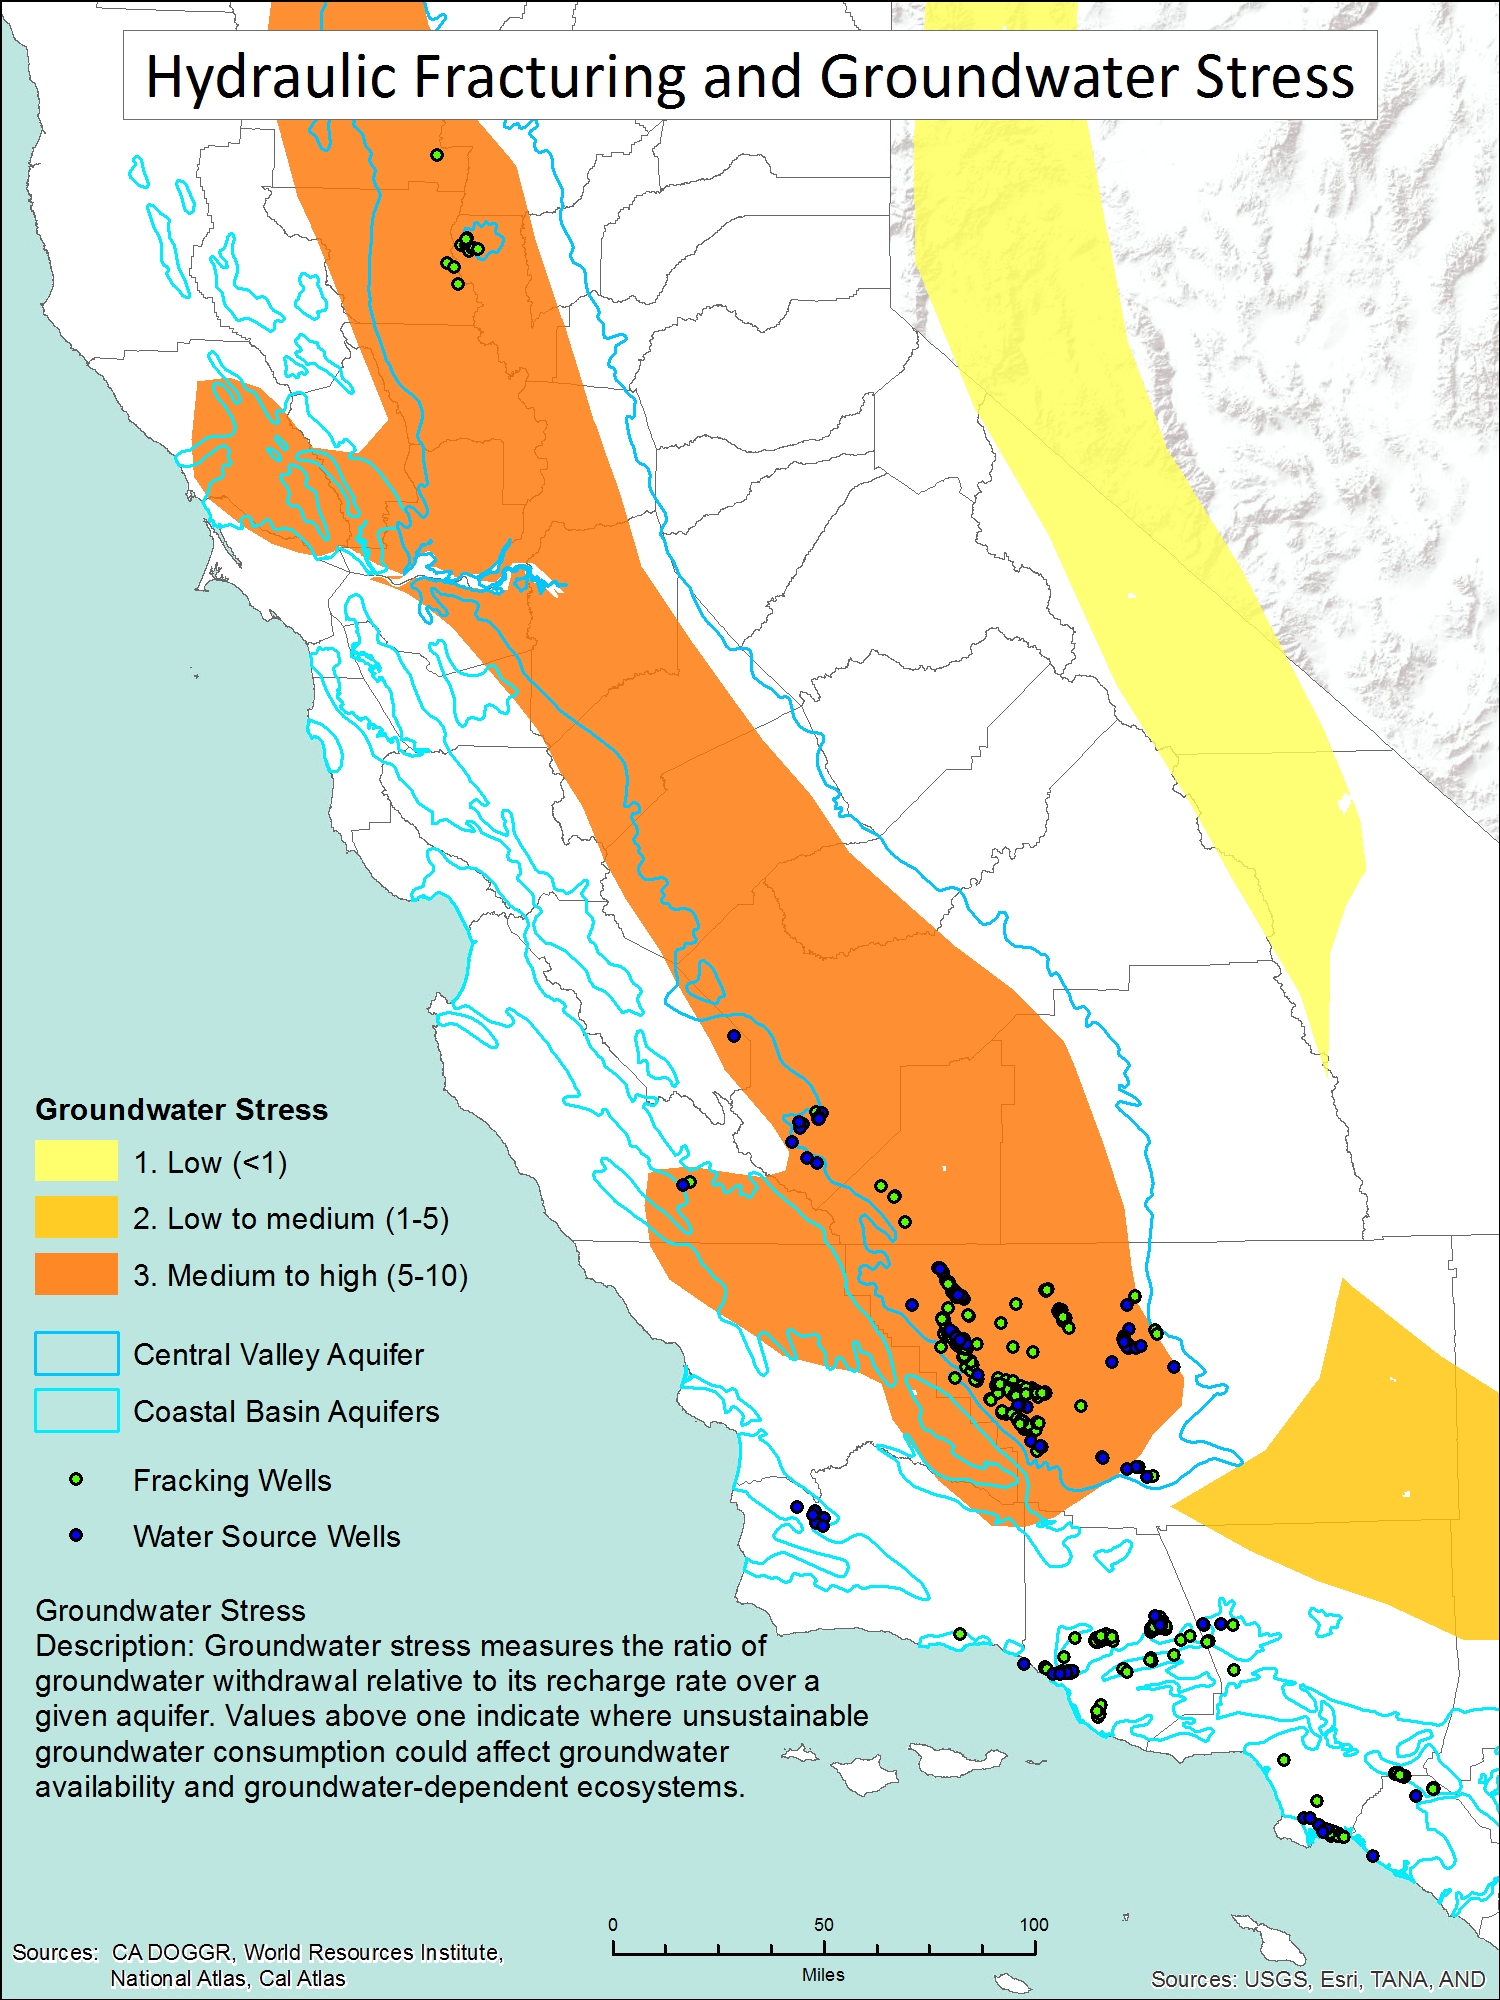 |
Groundwater stress (GWS) measures the ratio of groundwater withdrawal relative to its recharge rate over a given aquifer. Values above 1 indicate water is being withdrawn faster than the aquifer’s recharge rate. As you can see almost the entire Central Valley aquifer is under medium to high GWS. I layered the active water source (AWS) wells and fracking wells over the GWS and aquifer layers for analysis. I found that 100 AWS wells (73% of total) are drawing groundwater from areas under medium to high GWS as well as 701 fracking wells (58%) operating in these areas. Using select by location I determined how many of the above wells intersect with major aquifers. Of the AWS wells, 19 (14% of total) draw water from Coastal Basin aquifers and 97 (71%) draw water from the Central Valley aquifer. Of the fracking wells 20 (>2%) are drilled through the Coastal Basin aquifers and 695 (57%) are drilled through the Central Valley aquifer. This shows that the Central Valley aquifer, which is already at medium to high stress levels, will be more affected by increased water withdrawal and is at higher risk for contamination from fracking operations than the Coastal Basin aquifers. |
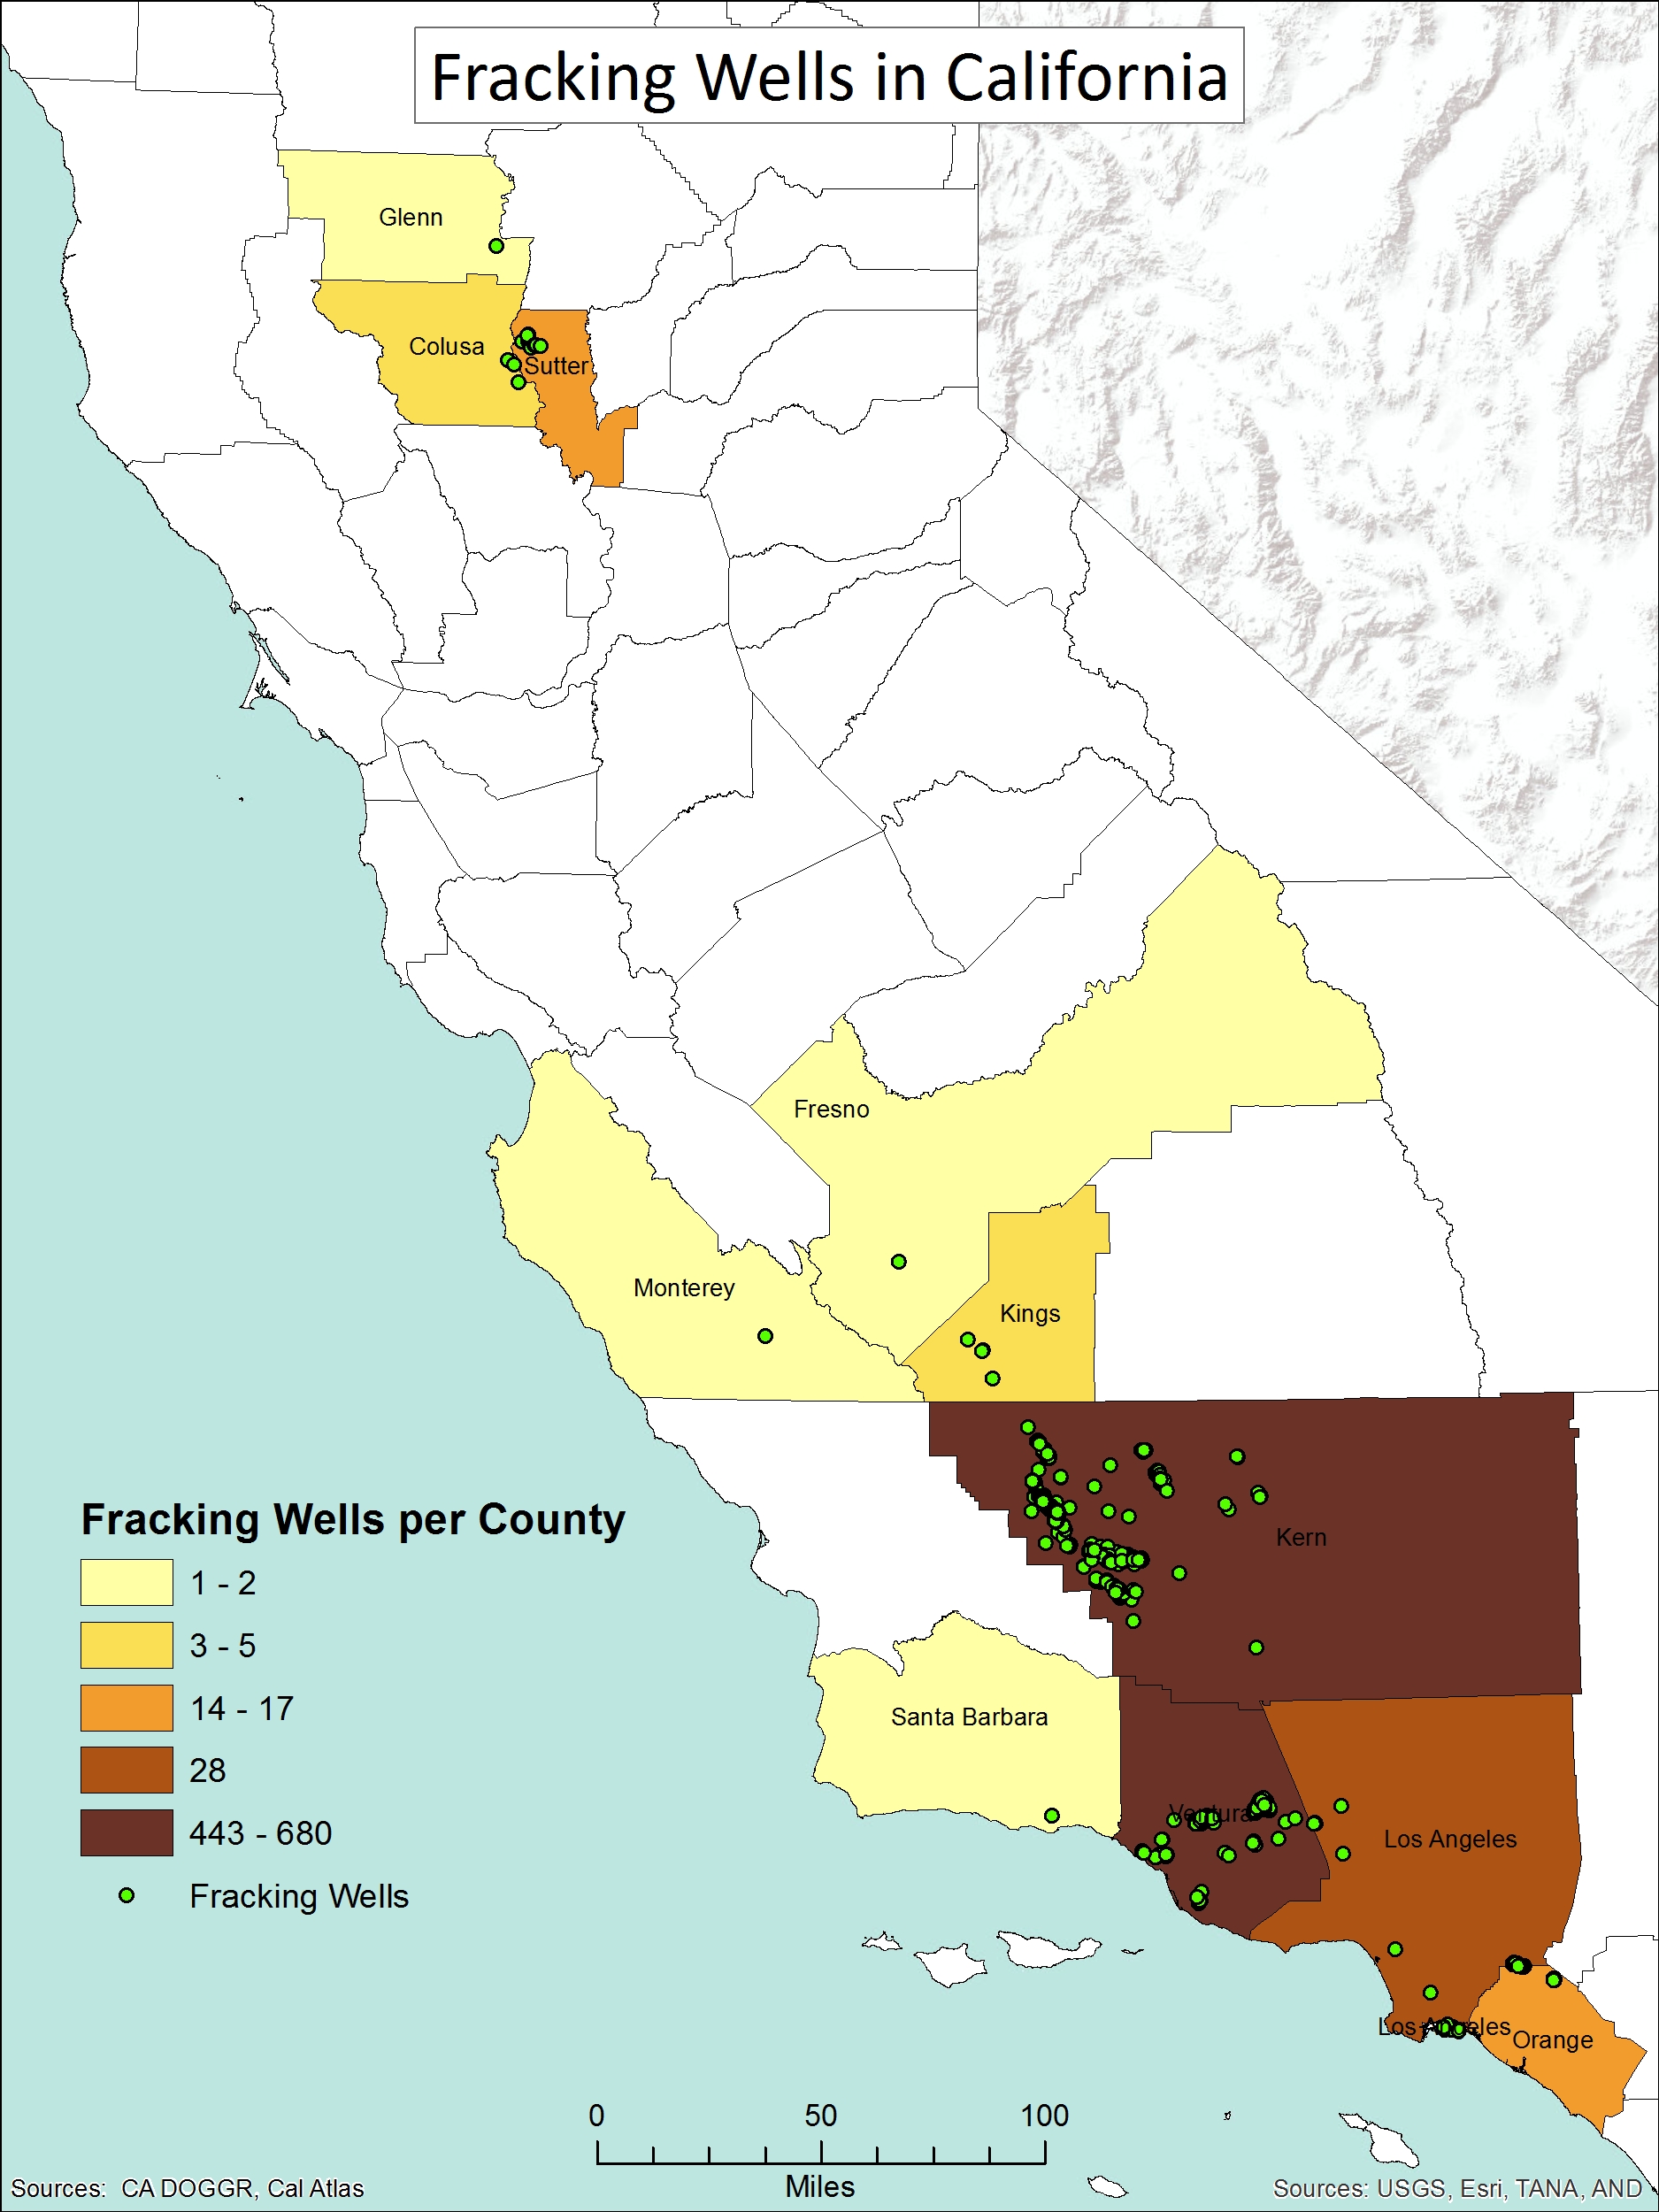 |
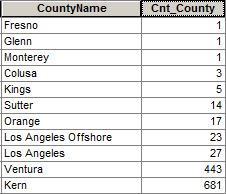
From the well data I identified 1,210 hydraulically fractured wells in 10 counties in California. With the exception of 18 wells in Glenn, Colusa and Sutter Counties they were all located in southern California from Fresno and Monterey Counties south to Orange County. 92% are in Kern and Ventura Counties combined with more than half in Kern County alone. (see table below) The 18 wells in Northern California are dry gas wells whereas the southern California wells are primarily fracked for oil.
 |
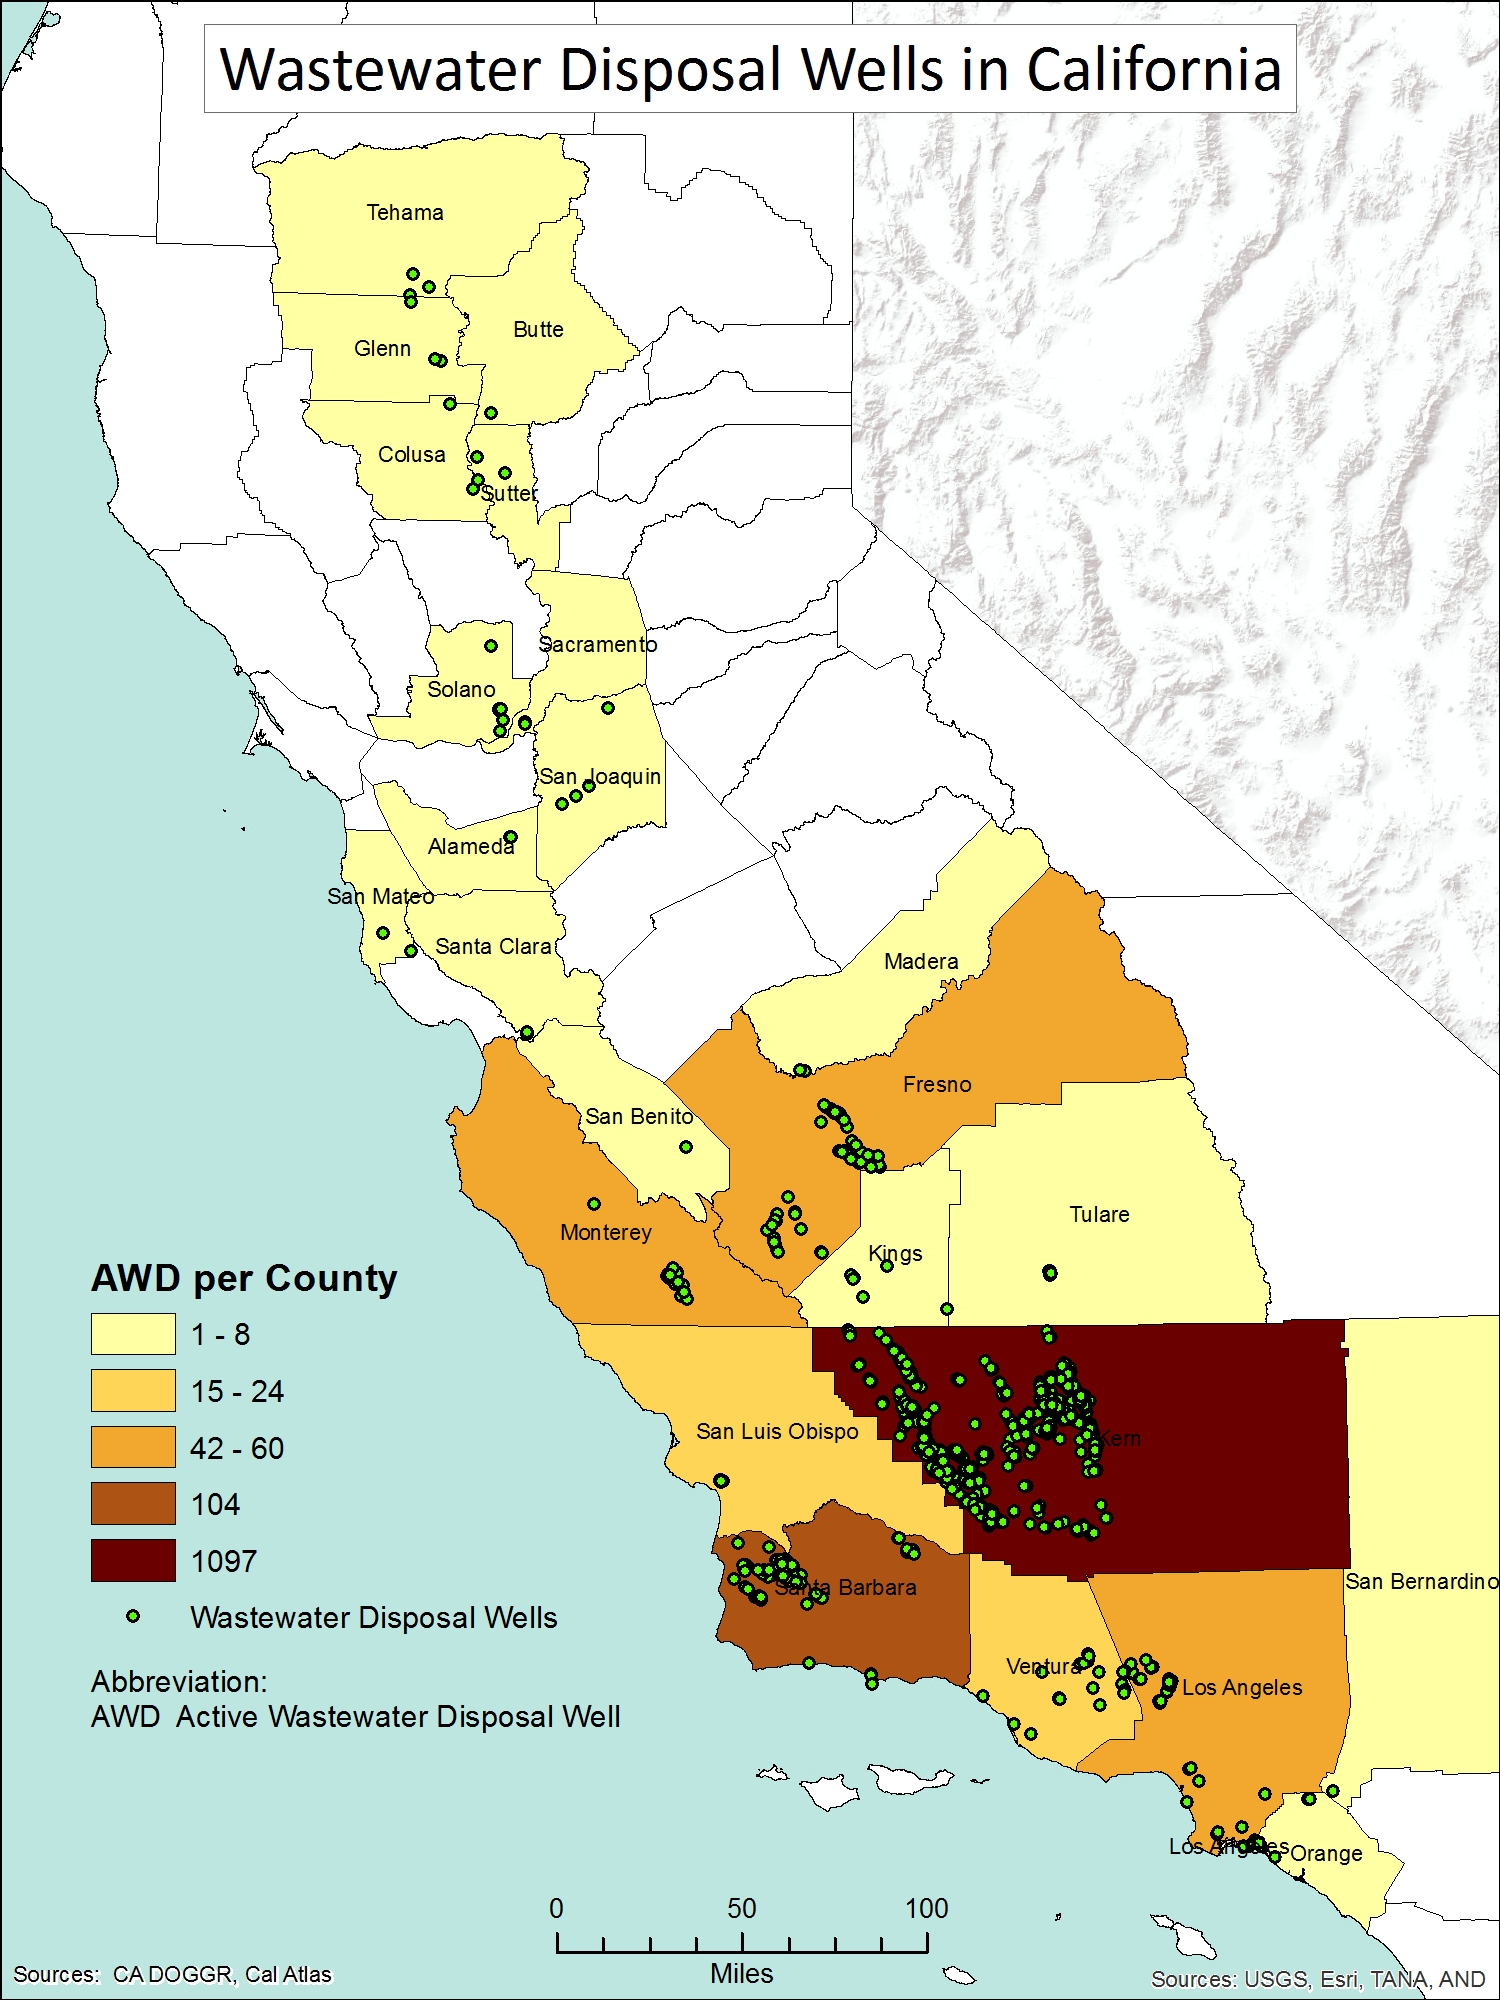 |
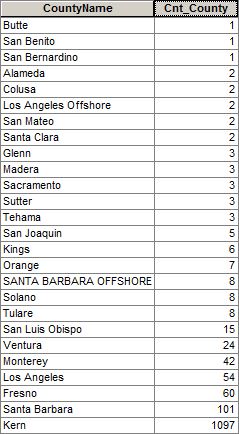
From the well data I identified 1,463 active water disposal (AWD) wells across 26 counties in California. 1,393 (95% of total) are located in 7 central and southern California counties (Monterey, Fresno, San Luis Obispo, Kern, Santa Barbara, Ventura and Los Angeles). 1,097 (75%) are located in Kern County alone. (see table below)
 |
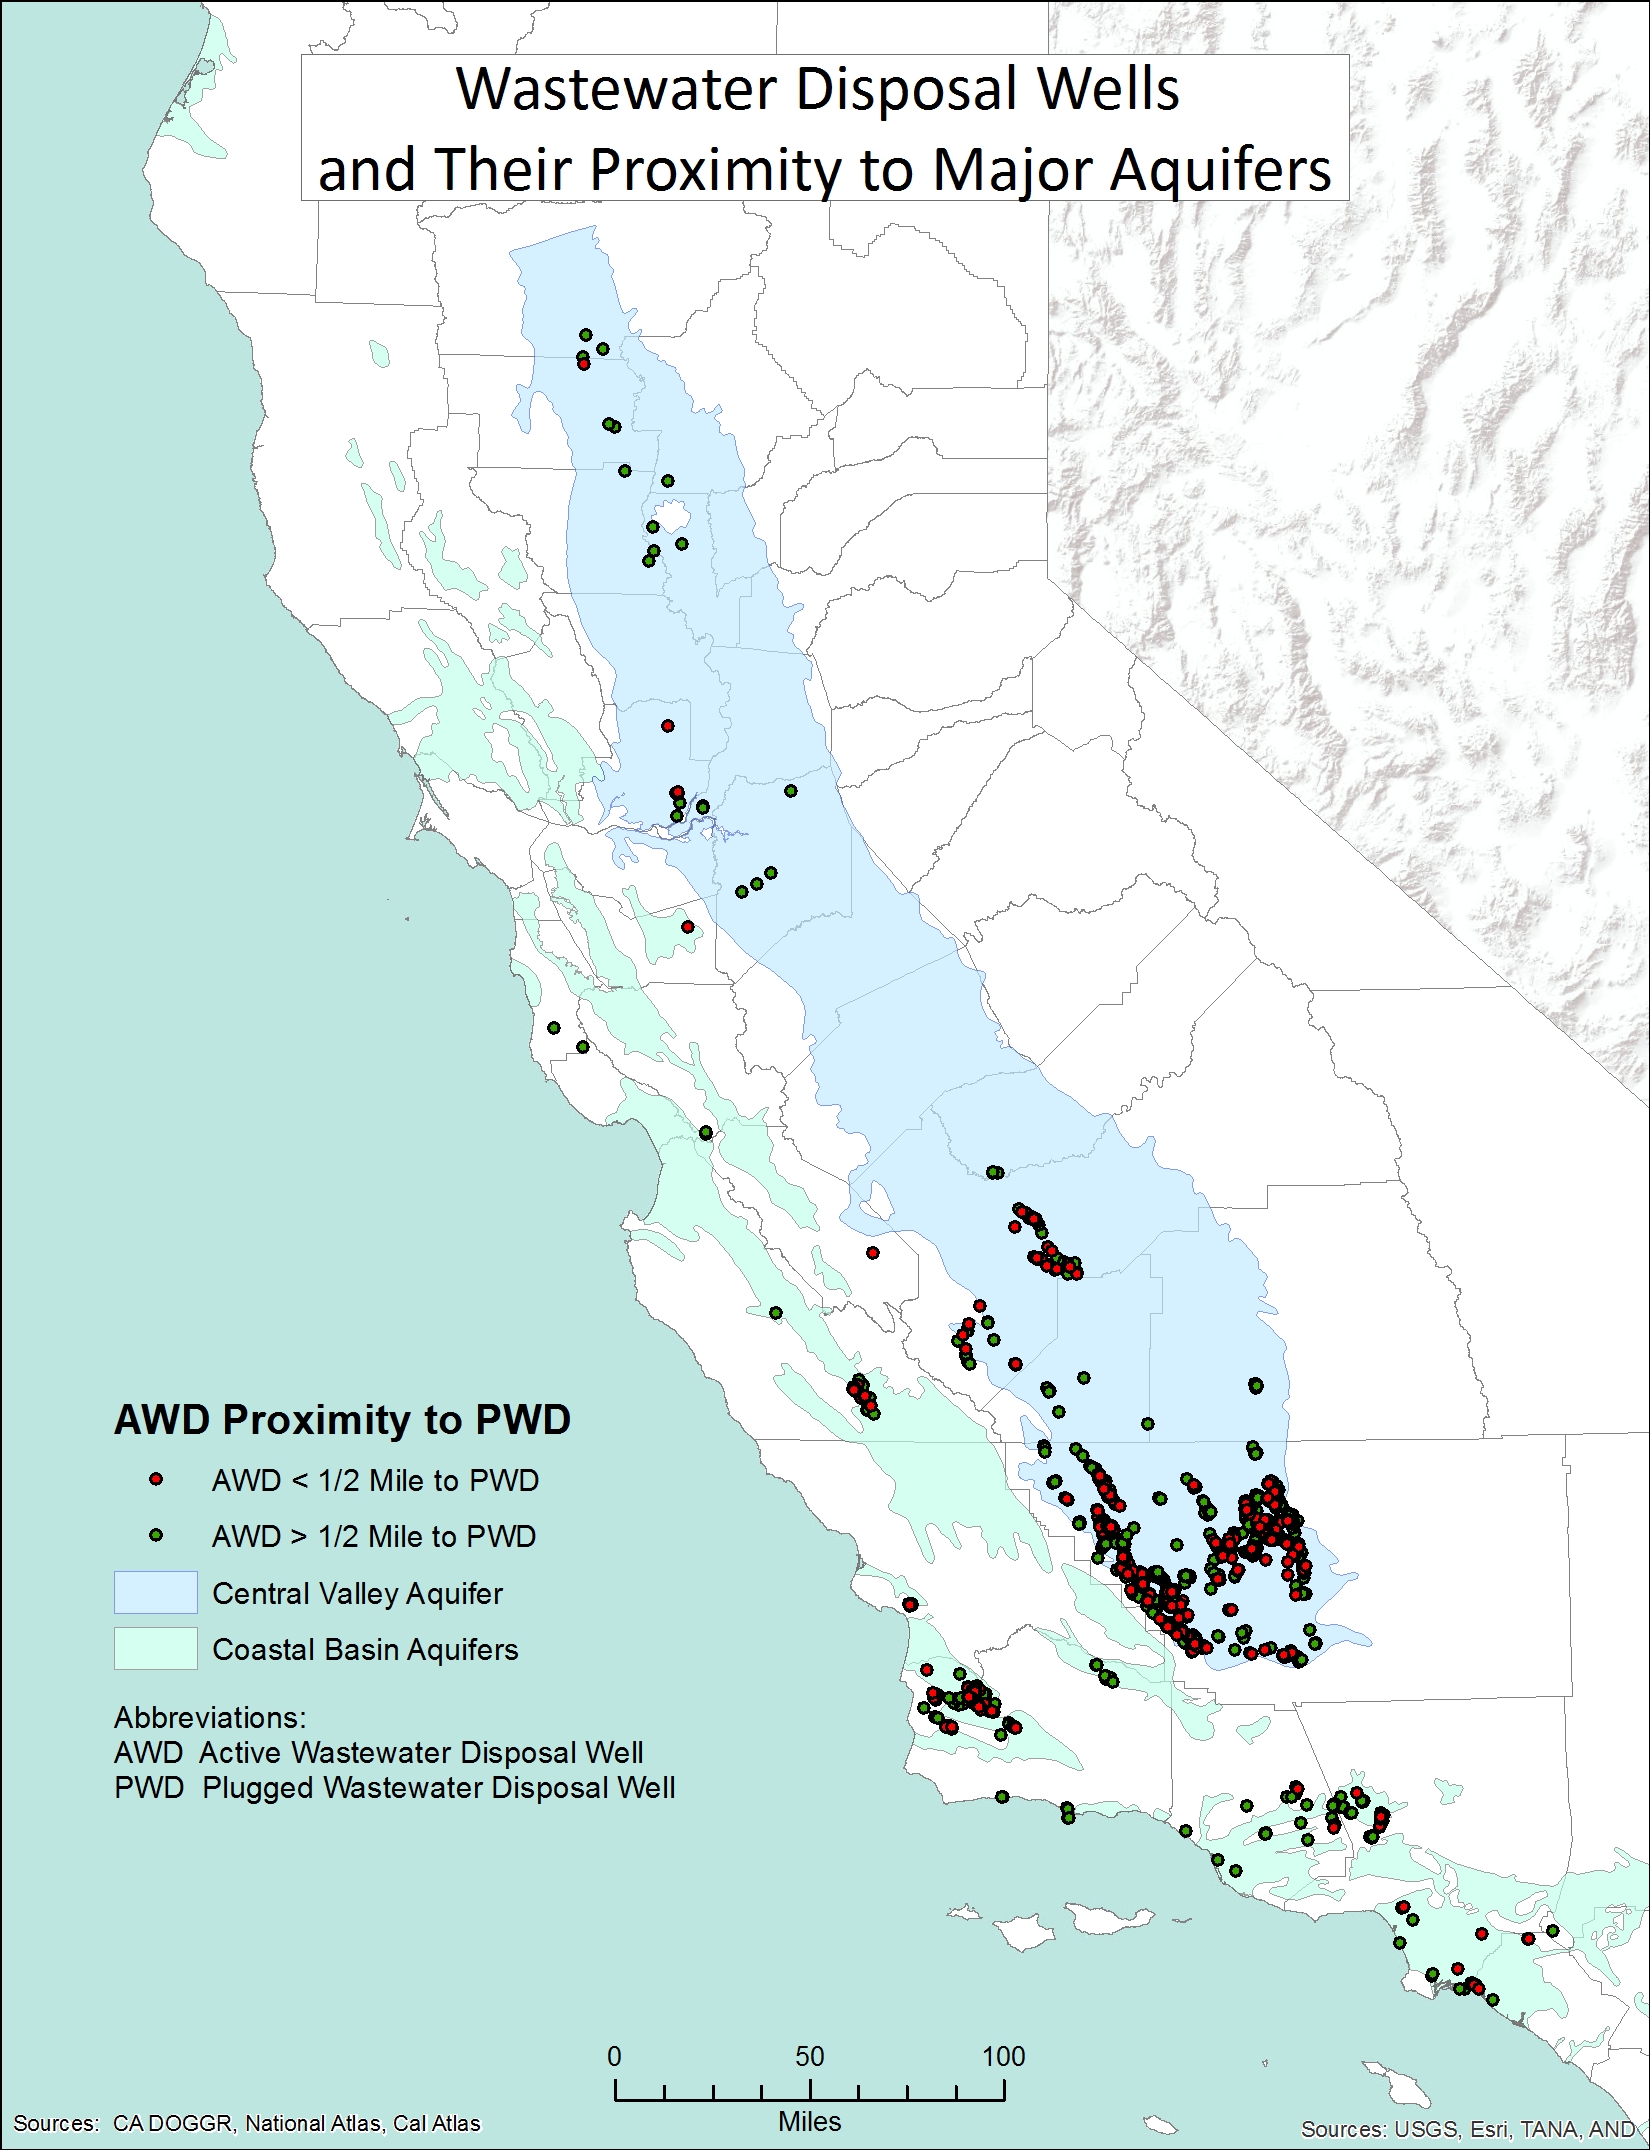 |
Fracking wastewater disposal wells have been linked to groundwater contamination in many states. Another source of contamination is the migration of wastewater from the disposal well to nearby wells that may have been improperly plugged or are corroded and leaking. I focused on plugged water disposal (PWD) wells within a half mile of active water disposal (AWD) wells since they are most likely drilled to the same depths making them the most likely route of contamination. I found that 1,177 (80% of total) AWD wells are drilled through and below the Central Valley and Coast Basin aquifers. 726 (49.6%) are within a half mile of PWD wells. |
|
Analysis
Looking at the results it is evident that a majority of the fracking operations in California are in Kern and Ventura Counties followed by Los Angeles and Orange Counties. I noticed after the fact that my summary table of the number of fracking wells per county didn’t include the one in Santa Barbara County. I determined that the wrong coordinates were entered into the well data and that well is actually located in Kern County. Kern County not only has the highest number of fracking wells but also the highest number of active water disposal (AWD) wells by a long shot. Santa Barbara County has the second highest number of AWD wells but no fracking wells. This is because the AWD wells are used to dispose of wastewater generated by any oil, gas or geothermal activities and Santa Barbara County does have traditional oil wells. I wanted to identify which AWD wells are currently used for the disposal of the high volumes of fracking wastewater but since any AWD well can legally accept fracking wastewater the data doesn’t differentiate. The results also show that Central Valley aquifer from Fresno County south through Kern County is at most risk for contamination from both fracking operations and wastewater disposal. It is also where most of the water source wells are located. These combined factors are especially troubling since groundwater is already being overdrawn in this area and annual water withdrawals in this area are at more than 80% of annual available flow.
I wanted to add a layer showing the extent of the Monterey/Santos shale deposit but there is no data out there that I could find. Even the images that I found varied quite a bit as to the extent of it. The All Wells data set from DOGGR had some inconsistencies and many null values and contained some new well codes that were absent in the look up table. Many of the well completion dates were null so I was unable to track when the fracking wells went online. 37of the wells identified as hydraulically fractured were plugged, 1 was an observation well, 1 was a water disposal well and 9 were just coded as “NEW”. The total number of fracking wells in the All Wells data set amounted to 1216, however I removed 6 wells that had geographic coordinates of 0,0 which put them at the intersection of the Prime Meridian and the Equator. I also removed 6 from the active water source well layer and 1 from the active water disposal well layer for the same reason. Since the inaccuracies were such a minute fraction of the overall data I feel that the well data was adequate enough to display the locational trends of the different well types. The Aqueduct global water risk maps from the World Resources Institute were just released this year and were a perfect fit for the focus of my project. |
|
|
Conclusions
I focused on fracking as it relates to water issues. A topic for future research would be air pollution concerns related to fracking from increased trucking activity, methane gas releases at drilling sites and the toxic fumes released into the air from the chemicals used in the fracking fluid. Another topic would be the proximity of fracking operations to other land uses like agriculture and residential neighborhoods. The fracking boom in California is just beginning and is expected to expand going forward. Since oil is a global commodity that is traded on the open market there is no guarantee that the oil from California’s oil shale will be used domestically. Drilling more wells will only increase demands on California’s tight water resources and increase the chances of groundwater contamination which is something California cannot afford.
| |
|
References
Baker, D. R. 2013.05.02. Nearly Half of Fracking Happens in Places Short on Water. http://blog.sfgate.com/energy/2013/05/02/nearly-half-of-fracking-happens-in-places-short-on-water/ . Last accessed 2013.05.03 Cooley, H. and K. Donnelly, 2012.06. Hydraulic Fracturing and Water Resources: Separating the Frack from the Fiction. p. 6, 27. http://www.pacinst.org/reports/fracking/full_report.pdf Last accessed 2013.05.11 Galbraith, K. and T. Henry, 2013.03.28. As Fracking Proliferates, So Do Wastewater Wells. http://www.nytimes.com/2013/03/29/us/wastewater-disposal-wells-proliferate-along-with-fracking.html?pagewanted=all&_r=1& Last accessed 2013.05.18 Garcia, D. 2013.03.14. Farmers Getting Fracked: State’s No. 1 Industry is Threatened. http://www.newsreview.com/chico/farmers-getting-fracked/content?oid=9296396 Last accessed 2013.05.02 Septoff, A. 2013.04.25. Harvard Study: FracFocus Fails to Provide Adequate Disclosure for Fracking Chemicals. http://ecowatch.com/2013/harvard-study-fracfocus-fails-disclosure-fracking-chemicals/ Last accessed 2013.05.18 United States. Government Accountability Office (GAO). 2012.01. Energy-Water Nexus: Information on the Quantity, Quality and Management of Water Produced During Oil and Gas Production. p. 12, 16. http://www.gao.gov/assets/590/587522.pdf Last accessed 2013.05.04 United States. Department of Energy. Energy Information Administration (EIA). 2011.07. Review of Emerging Resources: U.S. Shale Gas and Shale Oil Plays. p. 4, 75. http://www.eia.gov/analysis/studies/usshalegas/pdf/usshaleplays.pdf Last accessed 2013.05.11 Monterey Shale Image Snip: http://www.ceres.org/issues/water/hydraulic-fracturing-water-stress/hydraulic-fracturing-water-stress Last accessed 2013.05.04 |
|